
It’s still early days, but I’m pretty happy with my blog so far. The hosting solution is working well and I really like the look of the Stack theme. One thing that is missing for me at the moment is analytics. Admittedly, there’s not much content right now and there’s probably no one looking, but I’m the curious type, so it would be nice to see if any of my posts do attract any visitors.
Which tool?
There are tons of different solutions available for blog analytics, but sticking with the theme of trying to use Azure services to fulfil the requirement, I looked to Application Insights.
App Insights’ pricing model for data ingestion offers 2 plans (Basic Logs and Analytic Logs). The default being Analytic Logs, which has quite a generous allowance of 5GB/month being free to ingest. Basic logs have a reduced ingestion cost, are more restricted on querying and aren’t retained for as long.
Configuring
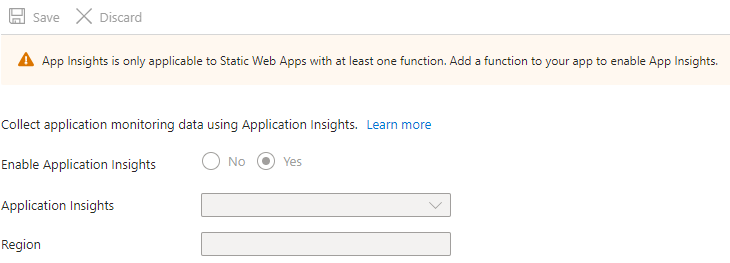
App Insights can be enabled through the Static Web App, but unfortunately it requires that your app has an API. As that’s not a requirement for my blog I need to find an alternative way of capturing the data.
App Insights also offers a JavaScript SDK that you can drop into your app, on each page that you want to collect telemetry. Microsoft provide the following piece of code to enable App Insights in your app:
|
|
The instructions for adding App Insights seem simple enough. The problem was that I’d had no experience with Hugo (the platform this blog is built on) until a few weeks ago and so I didn’t know how to get this JavaScript into the app. Then I found a very helpful blog post by Peter De Tender that describes just how to do this in great detail.
After following the instructions in Peter’s blog I noticed a slight difference in the configurations. His post is using the App Insights instrumentationKey but the MS documentation is using the connectionString. I then found a notice in the doc that says:
On March 31, 2025, support for instrumentation key ingestion will end. Instrumentation key ingestion will continue to work, but we’ll no longer provide updates or support for the feature. Transition to connection strings to take advantage of new capabilities.
I attempted to switch to using the connection string but I noticed that requests were being blocked by one of my Chrome extensions. After a short investigation I found that the telemetry is sent to different endpoints depending on the config:
| Config | Telemtry Endpoint |
|---|---|
| Instrumentation key | https://dc.services.visualstudio.com/v2/track |
| Connection string | https://{region}.in.applicationinsights.azure.com//v2/track |
My Chrome extension was blocking requests to the azure.com domain. As there didn’t seem to be any obvious way around this and I’ve got just under 2 years to work it out, I’ll stick with the instrumentation key for now.
Once the telemetry was working again, I made one more addition to the appinsights.html to check the URL of the site. If it’s running on localhost then don’t add the App Insights JavaScript SDK to the page.
|
|
This little check will prevent loads of false data being sent to App Insights from my local server.
Show me the data
Let’s go and take a look at App Insights and make sure the data has been making it through. There’s a short delay of a few minutes before the data is available in App Insights, but once it’s there you can find it under the Usage section.
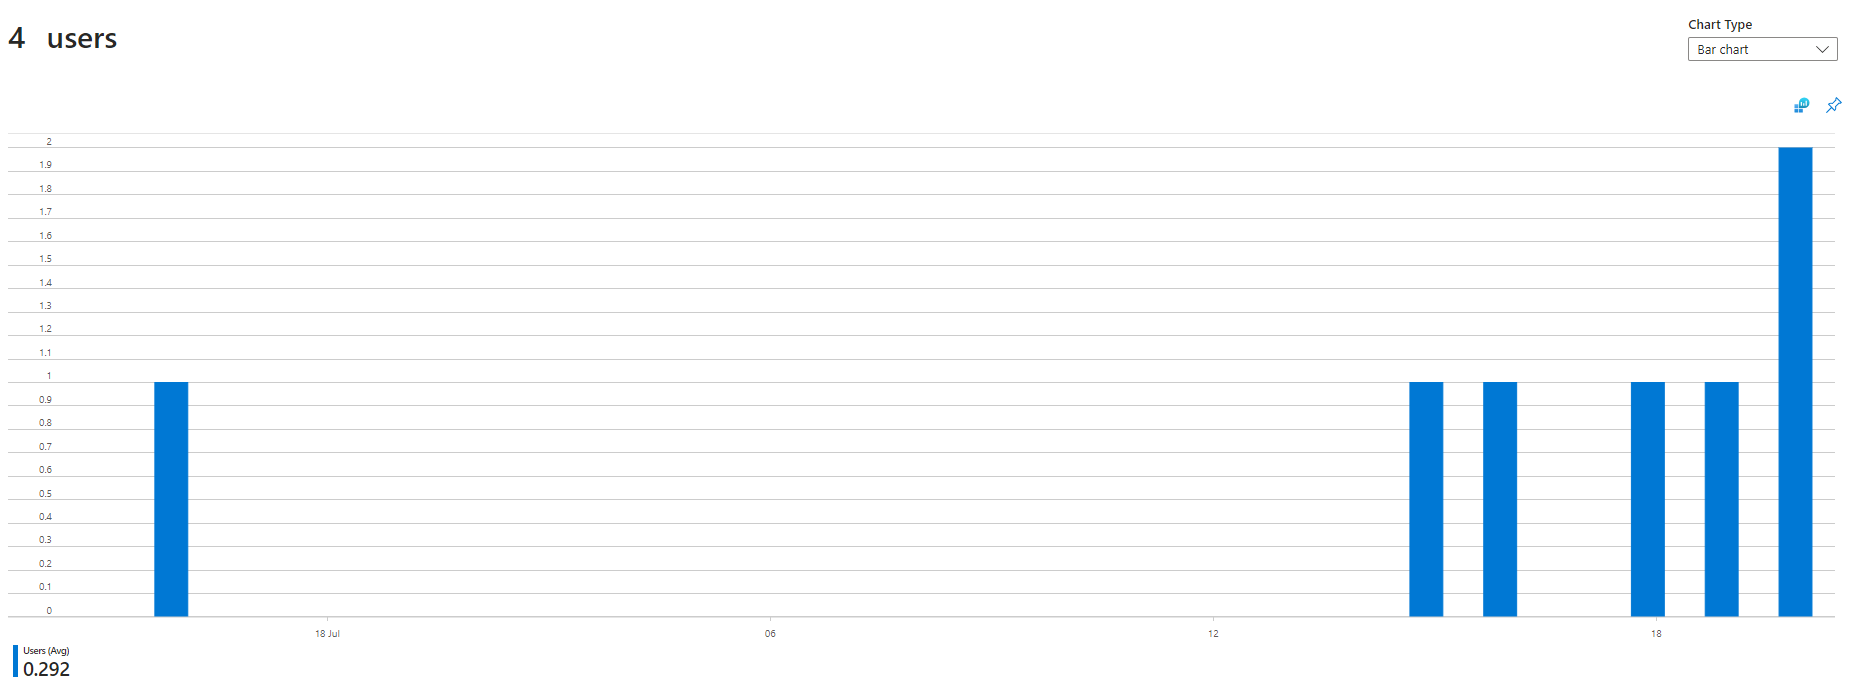
Clicking on the Users item in the menu we’re first presented with a chart showing the number of unique visitors over the past 24 hours.
Scrolling down the page there’s a button labelled View More Insights. Clicking this will show more detail about the visitors to the site. We get to see the country they’re from, as well as the OS and browser versions on their devices.
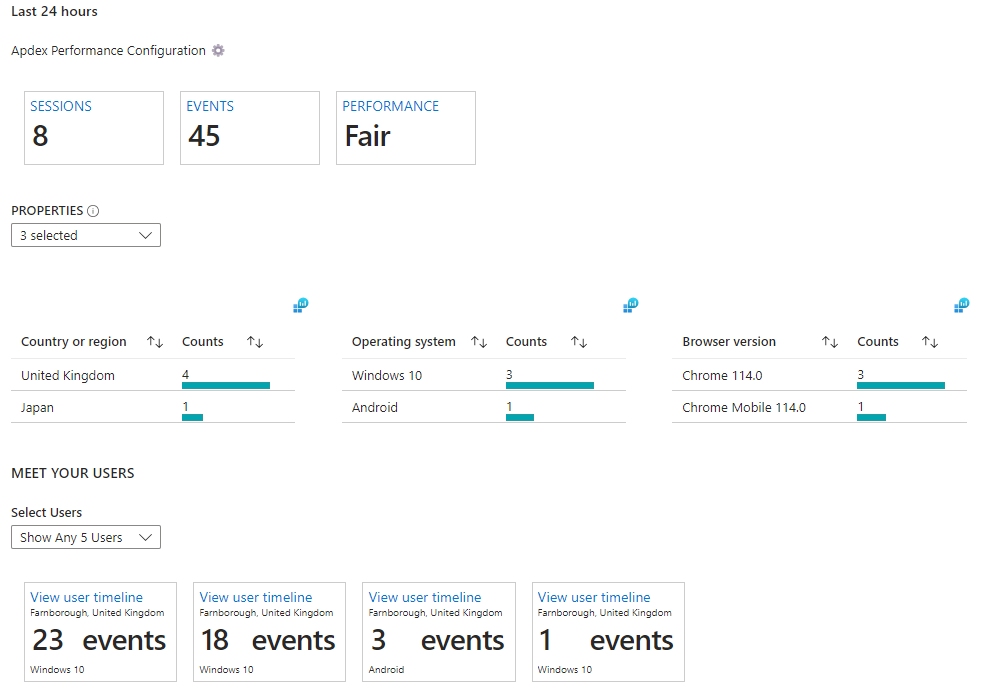
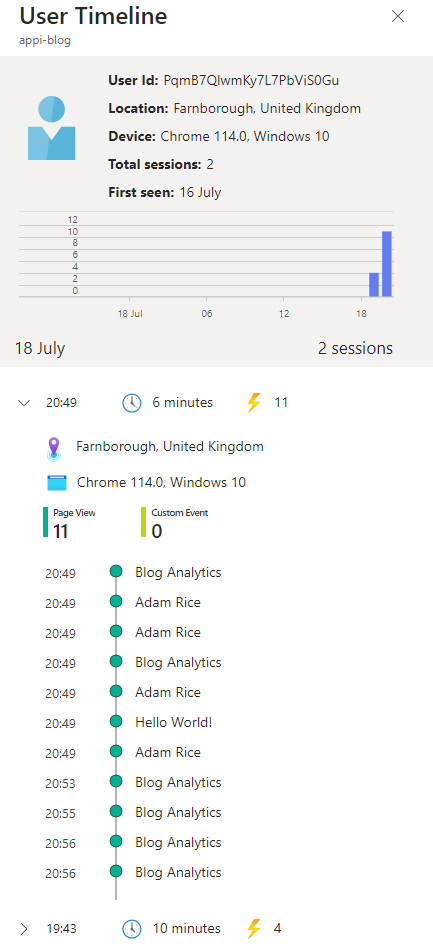
A little bit further down is a section showing the timelines of particular users. Clicking one of these boxes will give us a very detailed view of a user’s journey through the site. It shows how long a user spent on the site, the time they visited as well as the pages they visited in order.
Clicking on the More item in the menu presents a gallery of template workbooks that show the data in a variety of different ways.
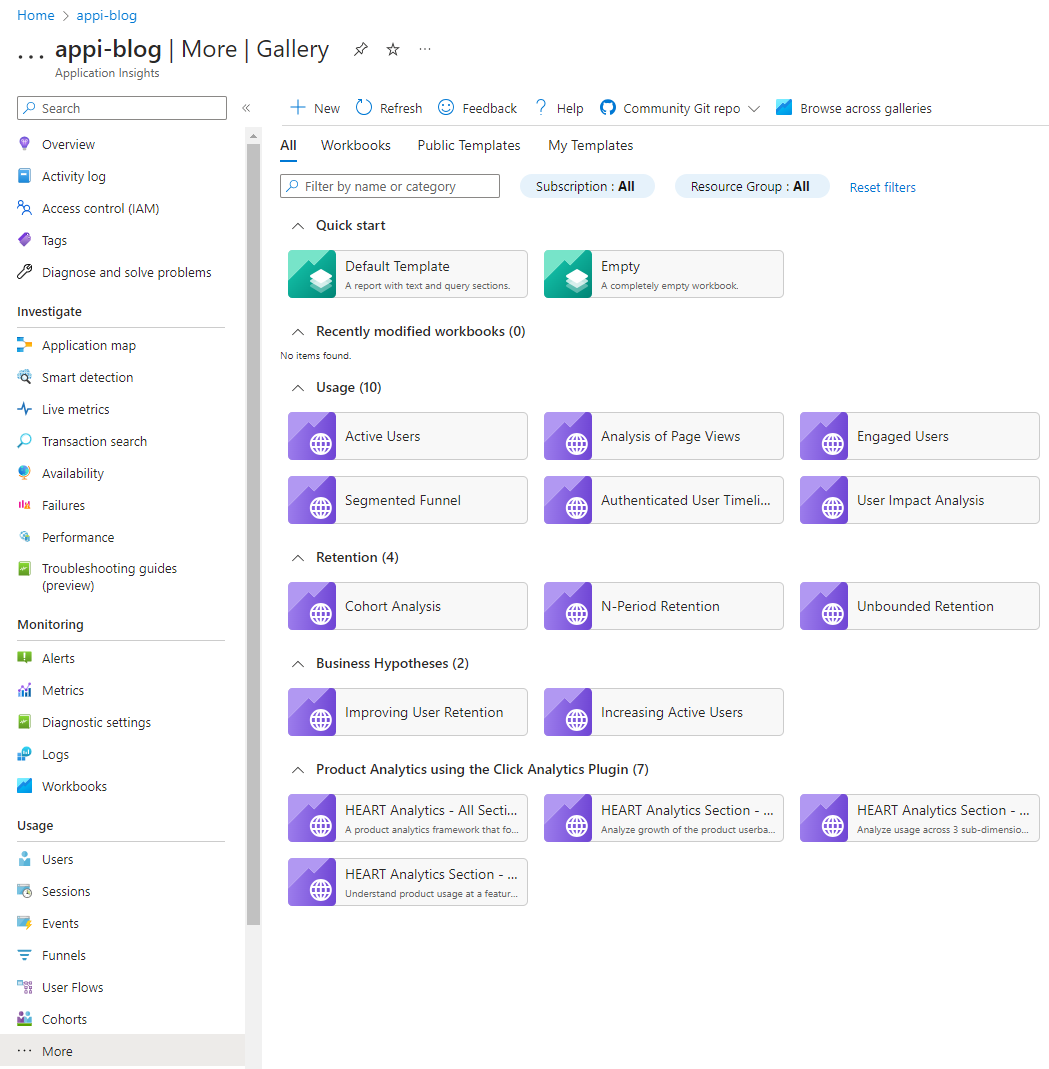
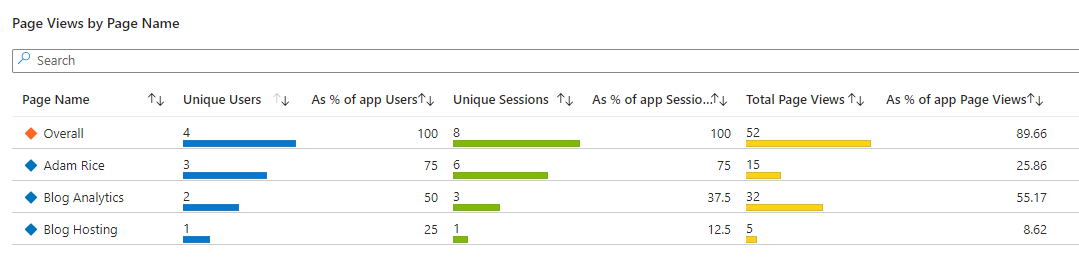
One template that was of particular interest to me was Analysis of Page Views. This view will be incredibly useful in enabling me to understand which posts are most popular and attracting the most visitors.
Conclusion
As we’ve seen, App Insights can be quite a powerful tool for viewing users’ activity on a site, and for small use cases that don’t generate too much data, it can even be free.